Takeoff Performance
The performance of an aircraft during a takeoff—in particular, the length of runway required before the aircraft becomes established in a climb—can become critical in the case of short runways or when the outside temperatures become extremely hot.
,%20Langley%20Flying%20School.gif)
Takeoff data is commonly presented to pilots in the form of a graph, as appears above. In the example shown, the graph is entered from the left, based on the airport’s density altitude. A horizontal line is then extended from left to right, first to intercept the two ground-roll lines, the first for a lightly loaded aircraft, and the second dashed line for the aircraft at gross weight. The line is then further extended to the right to intercept the 50’-obstacle lines, again with the two weights indicated by separate lines.
When using takeoff performance graphs such as this, it is crucial to know that the ground roll data is something to be virtually ignored. Only when an aircraft reaches an altitude of 50’ will its climb performance be stabilized and predictable. While the example shows that the aircraft will become airborne at about 1100’, it will not be able climb significantly away from the runway surface (and 50’ is not a lot of clearance) until it has travelled another 1100’. The rule of thumb, therefore is always to discard the ground roll numbers, and to instead use the clearance over 50’ when assessing the success of a takeoff.
Note also that the fine print must be carefully read. The performance values determined from this graph will only apply if the flaps are set to 0° (the application of up to 25° flaps will increase aircraft performance and decrease takeoff distances), the runway is paved, level, and dry, and there are no winds (a headwind would increase aircraft performance also). What can we do if we are faced with a wet or grass runway? There is no direction provided by the manufacturer in this case, but we can refer to general recipe rules that appear in From the Ground Up (see the section entitled Take off Performance Charts in Part 5,
General Airmanship. Here is a summary of some of these rules:
- A 10% reduction in takeoff distance can be applied for every 9 KTS of headwind, and a 10% increase can be applied for every 2 KTS of tailwind.
- A 15% increase in takeoff distance can be applied to dry grass runways; runway contaminants such as long grass, sand, mud, slush, standing water, or snow can easily double the takeoff distance.
- A 10% decrease in weight will result in a 10% decrease in the takeoff roll, while a 10% increase in weight will result in a 20% increase in the takeoff roll.
It is not uncommon for the aircraft manufacturer to produce a takeoff performance table, instead of a graph, as indicated below. This table presents data for takeoff weight of 2300 lbs., and in fact the table will include additional rows showing data for different weights (which has been excluded here).
,%20Langley%20Flying%20School.gif)
The interpretation of tables like this often involve interpolation. For example, if the pressure altitude is 2500’, and the temperature is 10° C, the total distance required to clear a 50’ obstacle will be the median (or middle) point between 1780’ and 1945’—what is 1862.5’, rounded up to 1863’.

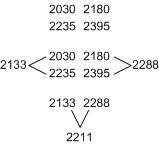
The interpolation process can also require an second adjustment; consider, for example, if the pressure altitude is 2500’ and the temperature is 35° C. To determine the 50’-obstacle distance in this case, you have to find the median (middle point) between four numbers—2030, 2180, 2235, and 2395. The interpolation of this—which works out to 2211’—is shown below:

In some cases, interpolation can be complicated, as you are not always selecting the median. In these cases, just eyeball the table to come up with your estimate. The difference of a few feet won’t make the difference—if the takeoff surface is marginal for one reason or another, you wouldn’t take the chance anyways.
Like the graph data, the table data contains fine-print information which must also be read carefully, but a final note should be made with respect to this table concerning the affects of temperature. Take a look at the difference between the distances required for a sea-level takeoff at 0°C and a sea-level takeoff at 40°—an increase in excess of 20’. Similarly, observe the effects of altitude on takeoff performance. Conducting a takeoff at 5000’ requires almost twice the distance of a takeoff conducted at sea-level.
.jpg)

